
Plastic Oceans: How Ten Rivers Create the Majority of Marine Microplastics
The Problem

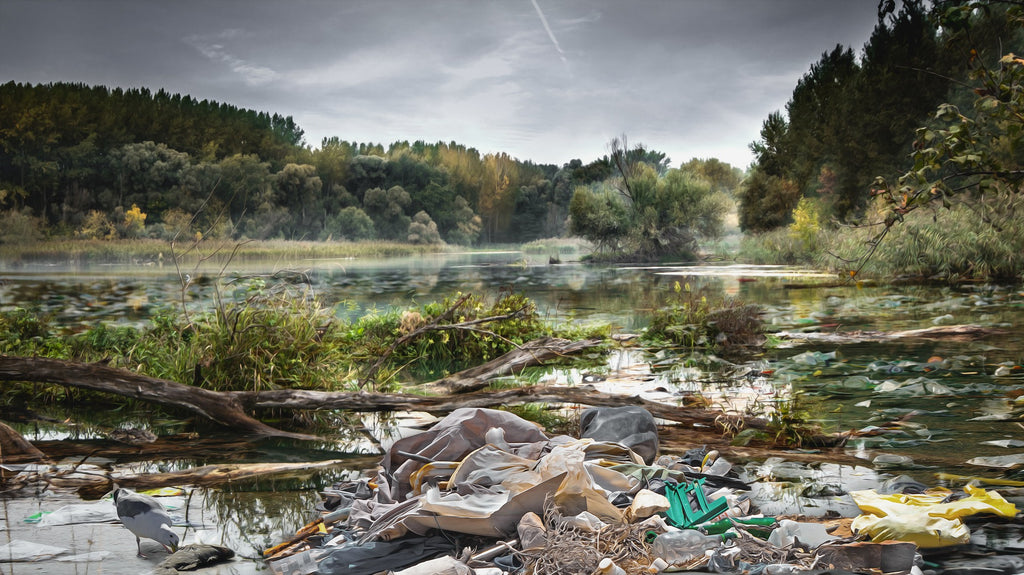
Tiny plastic particles known as microplastics can be found in the farthest reaches of the marine environment. Everywhere from the ocean floor to the Arctic, these microplastics can be found in the bodies of every type of marine organism from the smallest zooplankton to the largest predator. Most marine organisms are unable to excrete the plastic they ingest, causing it to build up in their bodies over time. These plastics are a danger to living creatures as they can create inflammation and leach hazardous chemicals into the organs causing problems ranging from liver failure to reduced reproduction. Negative health effects from ingesting plastic particles has even been proven to be passed on to the offspring of some marine organisms. Humans and other land-based organisms are no exception; microplastics can be found everywhere you look, and they get their start on land. The hydrologic cycle concentrates these plastics in rivers. Rain washes plastic litter into streams, and this garbage is broken up as it is carried downstream to the rivers and the sea where it is consumed by small organisms and works its way up the food chain.
The Cause
The growing global economy produced about 1.3 billion tons of municipal solid waste in 2012, and 10% of that waste was plastic. The most common types of plastic found in the oceans are the kinds used in plastic bags, storage containers, bottle caps, utensils, ropes, cups, coolers, and textiles. By 2025, the total amount of global waste is projected to increase to reach 2.2 billion tons/year. Urban areas and middle income economies with high populations produce the largest amount of waste. This waste is frequently not properly disposed of. Improperly managed waste occurs more frequently in low to middle income countries. In a 2017 study by the Hemholtz-Centre for Environmental Research, just ten rivers accounted for approximately 90% of the plastic entering the ocean. Eight of these rivers are located primarily in Asia, and two in Africa.
Rivers with the highest plastic load
- Yangtze
- Indus River
- Huang He (Yellow River)
- Hai He
- Nile
- Ganges
- Zhujiang (Pearl River)
- Amur
- Niger
- Mekong
The Solution
By focusing on just these ten rivers and reducing their microplastic output by half, it is possible to reduce total microplastic load delivered into the ocean by up to 45%. Although China produces more waste than any other country (in large part due to the demand for Chinese-made products), the rest of the world can still find a lot of plastic in its waterways. The San Gabriel River in Los Angeles was found to have the highest amount of macroplastics (larger-sized plastic particles) based on the same study that proved that Chinese rivers carried the most microplastics. By refocusing global consumption away from single use plastics and favoring zero waste products and plastic alternatives, it is possible to greatly reduce the amount of plastic in our rivers and oceans.
---------
PS: If you, or your organization is looking for a beach or river cleanup sponsor, please reach out to us!
Email : contact@eldr.supply
Socials : @ELDRsupply < Send us a photo of your glass water bottles!
Sources:
Schmidt, Christian; Krauth, Tobais; Wagner, Stephen. 2017.
Environmental Science & Technology 51 (21), 12246-12253
DOI: 10.1021/acs.est.7b02368
Hoornweg, Daniel; Bhada-Tata, Perinaz. 2012. What a Waste : A Global Review of Solid Waste Management. Urban development series;knowledge papers no. 15. World Bank, Washington, DC. © World Bank. https://openknowledge.worldbank.org/handle/10986/17388 License: CC BY 3.0 IGO.”
Thompson, Andrea. 2018. From Fish to Humans, A Microplastic Invasion May Be Taking a Toll. Retrieved April 29, 2020, from https://www.scientificamerican.com/article/from-fish-to-humans-a-microplastic-invasion-may-be-taking-a-toll/